What is an impact report? 9-step creation guide with examples + free template

Every nonprofit organization and public sector agency wants to make a lasting, positive change in the world. But how do you measure and demonstrate your organization’s impact to funders, donors, and other stakeholders? There’s one clear way: a data-driven impact report that tells your organization’s story.
An impact report typically highlights the outcomes your organization has achieved and their effect on the community. It strengthens your supporters’ trust and engagement while sharing evidence of how your organization makes the best use of funds raised.
In this guide, we’ll explore the basics of impact reporting so you can better understand and prove the success of your programs. We’ll also share tips, examples, and a template to help you get started.
Ready to jump in and start proving your impact to funders? Download our free eBook to learn how to craft an impact report that focuses on what funders want to see.
What is an impact report?
A nonprofit impact report is a document that details the outcomes and tangible impact of a certain program, initiative, or service. Rather than detailing every event or initiative, impact reports focus on sharing the outcomes via data and stories.
Nonprofits, public sector agencies, and even for-profit companies that want to demonstrate the social impact of their corporate philanthropy efforts use impact reports.
Impact report vs. annual report
Compared to an annual report, impact reports tend to be more focused on specific initiatives and may have different intended audiences. Instead of discussing the entirety of an organization’s performance over a year, impact reports typically zero in on one program and are often geared more toward funders.
Why impact reporting is important
Regularly creating and sharing impact reports is essential for your organization’s long-term growth. This is because impact reporting helps you better understand your organization’s outcomes, share them with stakeholders, and cultivate trust and long-term funder and supporter relationships.
Understand your programs’ effect on participants
Analyzing and visualizing program data allows you to see exactly how a program affected participants and whether or not you achieved your goals.
Soliciting feedback and testimonials for the impact report also gives you a more thorough understanding of participants’ experiences.
Prove outcomes to funders and other stakeholders
Your organization relies on grants to fund its work, and those grants likely have reporting requirements. Funders need to see that you put their funds to good use and understand how you did so. With impact reports, you can clearly and effectively report on your program outcomes.
Build trust with your partners
Whether you have corporate partners or work with other organizations, demonstrating your impact effectively shows your partners that your work is worth supporting. This helps you improve relationships and retain important partnerships over time.
Find opportunities for improvement
Creating an impact report involves analyzing your organization’s biggest successes and challenges, which helps identify actionable ways to improve. You can apply this insight to future iterations of the same program, along with the development of new programs.
Support your organization’s future growth
Once you have an impact report that demonstrates your organization’s ability to deliver quality services, you can use it to build new relationships with prospects as social proof of your abilities. You can also present these findings to shareholders and secure more essential funding in the future.
Essential elements of a nonprofit impact report
While the content of an impact report can vary widely depending on your organization’s goals and audience, the most successful nonprofit impact reports include the following baseline components:
- Executive summary: Start with a one-page summary or letter that describes the program or initiative you’re reporting on, the purpose of the impact report, and its most notable findings.
- Organizational or program goals: Give a quick overview of your organization’s purpose and the program’s specific, measurable goals.
- Key activities: Explain the components of your program, your organization’s activities, and any other relevant actions taken.
- Methodology: Include a brief explanation of where you sourced your data, how you analyzed it, and any tools you used.
- Measurable outcomes: Share the quantitative data that proves the impact of your program, with key metrics highlighted alongside data visualizations, such as charts, graphs, and tables.
- Testimonials and stories: Add quotes, photos, and stories of your participants’ experiences in your program that demonstrate its impact.
- Donor impact: Highlight how donor contributions directly led to achieving your goals, such as “$50 provides a week of meals for a family in need.” Nonprofit tools like Bonterra EveryAction and Network for Good can help keep track of these details.
- Challenges and opportunities: Discuss any challenges you faced that may have affected your results, along with ideas for future improvement.
- Financial transparency: Provide an honest breakdown of your program costs and funding sources.
- Clear call-to-action: Close your report with a nod to what you hope your reader will do next: donate, volunteer, partner, or advocate.
In addition to these core elements, some reports also include:
- Engaging visuals: Visual storytelling elements like graphs and data visualizations
- Interactive elements: Let readers click into deeper data, filter details, or watch videos to increase engagement
- Social media components: Add statistics, quotes, or branded graphics that make it easy for readers to promote the report’s findings
Consider using a basic impact report template as a starting point, then evaluating whether you need any additional elements. Try to keep your final impact report as concise as possible so as not to overwhelm readers.
How to write an impact report that inspires action in 9 steps
To kick off your impact report, there are a few clear steps to follow.
1. Define your goals and KPIs
To prepare the most effective report, clarify your goals and focus. Nonprofits often use impact reports to demonstrate accountability to donors and highlight the real-world impact of their programs, but they can also support grant funding, inform strategic planning, or mobilize stakeholders.
Also, determine the KPIs you want to use to measure your impact. This will help you quantify progress and success, and make it clear how your work translates into meaningful change.
Common KPIs to track include:
- Number of people served
- Outcome success rates
- Cost per outcome
- Funds raised and/or distributed
- Volunteer engagement metrics
- Partnership growth
- Satisfaction scores
For a head start, reference Bonterra’s Nonprofit KPI Workbook.
2. Reflect on your audience
Clarify who you’re creating this impact report for. Depending on your goals, your audience might be:
- Current funders
- Donors and other supporters
- Potential funders for future programs
- The general public
Your primary audience and goals will determine how you structure the report and which elements to focus on. For example, an impact report aimed at securing future funding might focus on what funders want, such as proving overall organizational progress, while a report used to fulfill grant requirements may be more data-heavy and emphasize the financials.
3. Choose a report format
Once you have most of your report’s content ready, decide how to format it and what visuals you want to include (such as photos and data visualizations). You can choose from a number of common impact report formats, such as a:
- Basic PDF
- Downloadable eBook
- Interactive page on your organization’s website
- Physical copy
- Video
Each format comes with its own advantages and disadvantages. PDFs are the most common choice because they’re easy to distribute, save, and read, but some nonprofits may not find them interactive enough. A website page or video, on the other hand, provides more room for creativity but requires more time and effort.
Your audience should inform your formatting decisions, along with considerations such as your budget, skills, and time constraints. For instance, a grantmaking organization may want to see your impact report in PDF format, while the general public might find a website page more accessible and appealing. Based on the format you choose, determine how many visuals you need and design them to fit naturally within the report.
4. Gather and analyze data
Gather relevant program data and use data analysis tools to identify trends, patterns, and conclusions. To simplify this process, leverage software that tracks inputs and outputs and easily translates them into clear outcomes you can report on.
For instance, Bonterra Apricot comes with comprehensive reporting, data analysis, and visualization features that help you quickly dive deeper into your data. Customizable forms ensure that your staff collect the right data in the first place, and advanced features enable you to compare the impact of different programs and automatically deliver reports to key stakeholders.
Refer back to the KPIs and desired outcomes you outlined earlier to decide which data to include in your impact report. Remember to include both outputs and outcomes to provide a holistic view of your program’s impact.
5. Seek out testimonials
Next, see if you already have participant testimonials on hand that could be a valuable addition to your report. Review the answers they provided on feedback surveys and responses to follow-up communications, looking for any especially descriptive, positive statements.
If you don’t have testimonials, identify participants you’d like to interview and ask them about their experience. You might conduct an in-person interview or just ask them to send comments via email. Either way, make sure you ask each participant for permission to include their testimonial, name, and photo (if applicable) in your impact report.
6. Create engaging visuals
To make your report memorable and engaging, consider adding charts, graphs, and icons. This can help simplify data and make complex information easier to digest, which is perfect for busy stakeholders who want to understand your organization’s progress.
Visuals can also add transparency, letting you clearly display how you used resources and achieved outcomes. Plus, compelling graphics can be shared on social media or in other materials, expanding your reach and inspiring new audiences.
7. Draft the report
With all the pieces in place, you’re ready to draft your impact report by writing the copy. Remember to write for your audience and think about what they will want to know most about your organization’s impact, answering questions such as:
- Do they need to see all the financials?
- Will they want to view the data right away or read stories of participants’ success first?
- How much context do they need for certain metrics?
Focus on telling the story of your nonprofit’s impact in clear, compelling terms. Don’t assume that the data will speak for itself. Be sure to expand on the meaning behind the numbers, translating data points into understandable, real-life impacts.
8. Publish and distribute your findings
After finalizing the content of your impact report, publish it and send the report to its intended audience. If your audience is the general public, this might involve posting the impact report on your website and sharing it with your donor base via email. If it needs to go to funders, plan to send it directly to each of your points of contact for the organizations that granted you funds.
9. Leverage your report to enact meaningful change
An impact report is a strategic tool that can help shape future decisions. It gives you a chance to assess what went well and where you ran into challenges, letting you refine your programs and allocate resources more effectively.
Sharing these insights within your organization fosters a culture of continuous improvement, while sharing externally can strengthen donor trust and show strong accountability and transparency on your organization’s part.
Inspiring impact report examples
Impact reports take a variety of shapes and forms, so it helps to see a few examples before you start brainstorming ideas for your own report. That’s why we’ve compiled the following nonprofit impact report examples from Bonterra customers:
The Braille Institute
The Braille Institute supports communities in Southern California by providing free classes and services to those with vision impairments. Their impact report design offers multiple formats, with options to scan the website (with a clickable table of contents), download a Word document, or download a PDF. The report features several stories of program recipients, complete with photos and testimonials, showcasing the human impact of the organization.
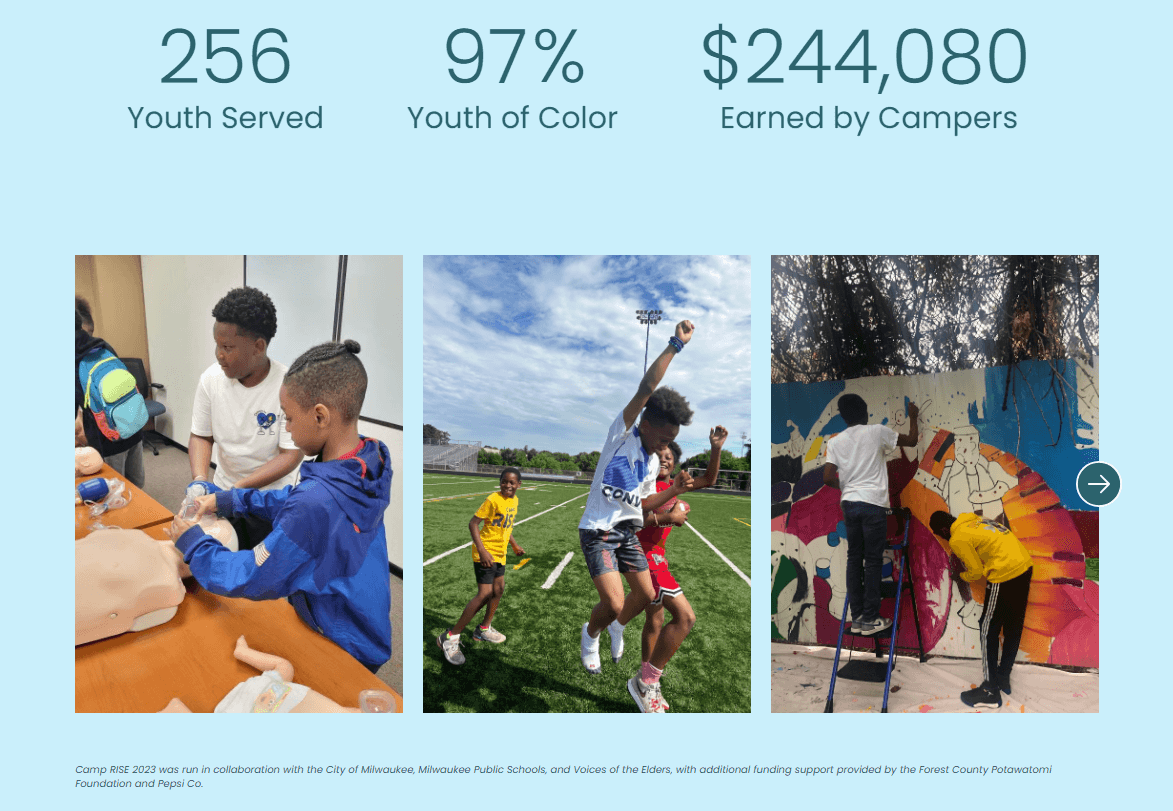
Employ Milwaukee
Employ Milwaukee is an organization that provides workforce development resources to youth and adults in Milwaukee, Wisconsin. To showcase its impact to the wider public, this organization formatted its impact report as a dynamic, interactive webpage. The report includes photos, standout metrics, and first-person testimonials along with descriptions of each of its programs.
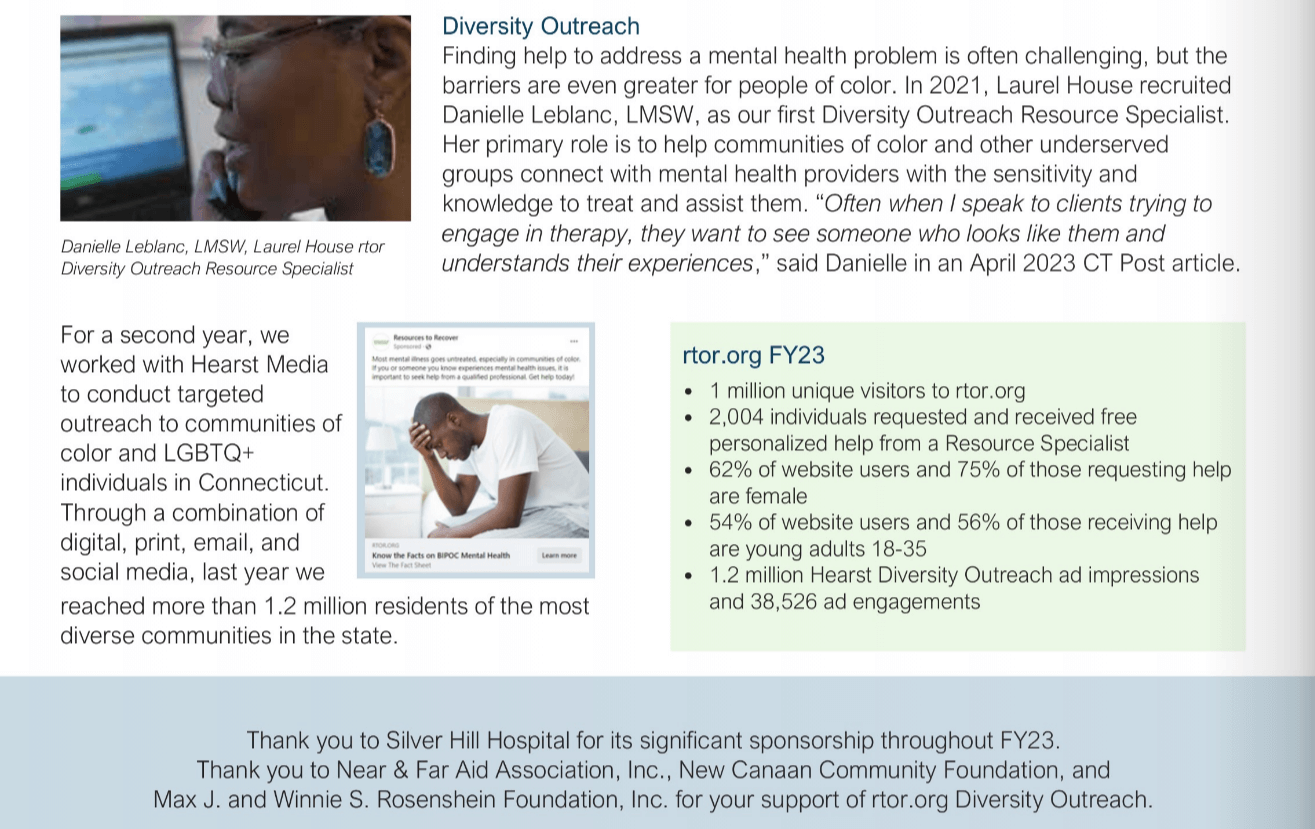
Laurel House
For a more detailed, text-heavy example, look at Laurel House’s impact report. This domestic violence prevention agency used Bonterra’s case management tools to track outputs like the number of visitors to its emergency shelter and the percentage of participants who were female. Laurel House chose to format its report as an eBook that any visitor to its website can explore.
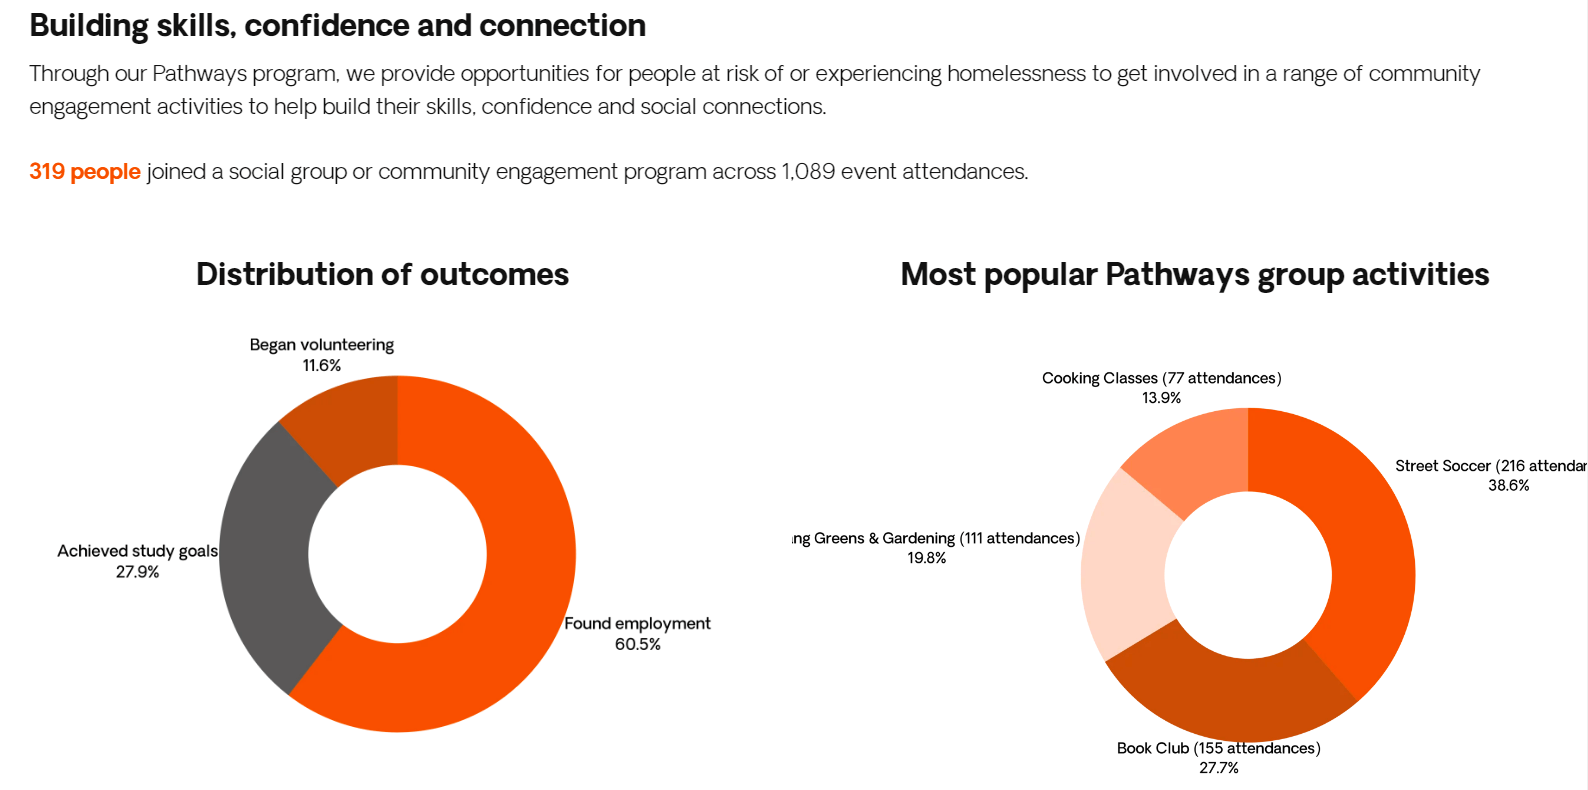
Hutt St Centre
Hutt St Centre is an Australian nonprofit that provides resources and support to people experiencing homelessness. In their 2024 Annual Report, the organization included a variety of data visualizations. These graphics make it easy for readers to understand program outcomes and see which aspects of the program participants relied on most.
Free impact report template for nonprofits
This one page impact report template will help you get started. With placeholders for text, data, and graphics, you’ll be prompted to input all of the pertinent information. Don’t forget to update the branding to reflect your organization properly.
Remember that an impact report should tell a story, so be sure to include details that showcase what your organization has accomplished.
Elevate your impact report with Bonterra
An impact report provides an opportunity to showcase your organization’s achievements, leading to increased support and higher donations. The right software can track data and accomplishments over time, providing you with valuable insights to craft your impact report.
When you’re ready to create your next impact report, Bonterra can help. With case management software that streamlines processes and tracks key data, as well as robust nonprofit software that consolidates essential tools with dynamic reporting, Bonterra lets you focus on telling your story.
Ready to get started? Try Bonterra’s nonprofit software solutions today.
FAQ
What is the purpose of creating an impact report?
The purpose of an impact report is to share the measurable impact your organization has made on its community by telling the story behind your efforts. This report demonstrates to stakeholders, especially those providing financial contributions, how you’re using resources and what results you’re achieving. The benefits of an impact report include increased trust and accountability.
How do you write an impact report?
To write an impact report:
- Define your goals and audience.
- Gather and analyze data to tell your story.
- Include testimonials from participants, if possible.
- Organize this information into a clear structure that showcases your organization’s achievements and outcomes.
- Incorporate compelling visuals where possible.
- Create a clear call to action to close things out.
What are the best practices for impact reporting?
Best practices for impact reporting include:
- Being transparent about both your successes and learnings
- Sharing data alongside storytelling and visuals to make it digestible and human-centered
- Making sure the report is easy to navigate and share
Don't miss out
Get the latest insights delivered to your inbox.


